Below are preliminary examples of this for both .NET and JVM.
DbgCLR.exe (graphical) and
CorDBG.exe (textual) supplied with the
.NET Framework SDK
as well as with the built-in debugger in Visual Studio .NET.
[File->Open Solution...].
Files of types: All project files and navigate to foo.exe.
Double click foo.exe.
[Debug->New Breakpoint (Ctrl-B)] specify
breakpoint in Function program.Do.
[Debug->Start (F5)].
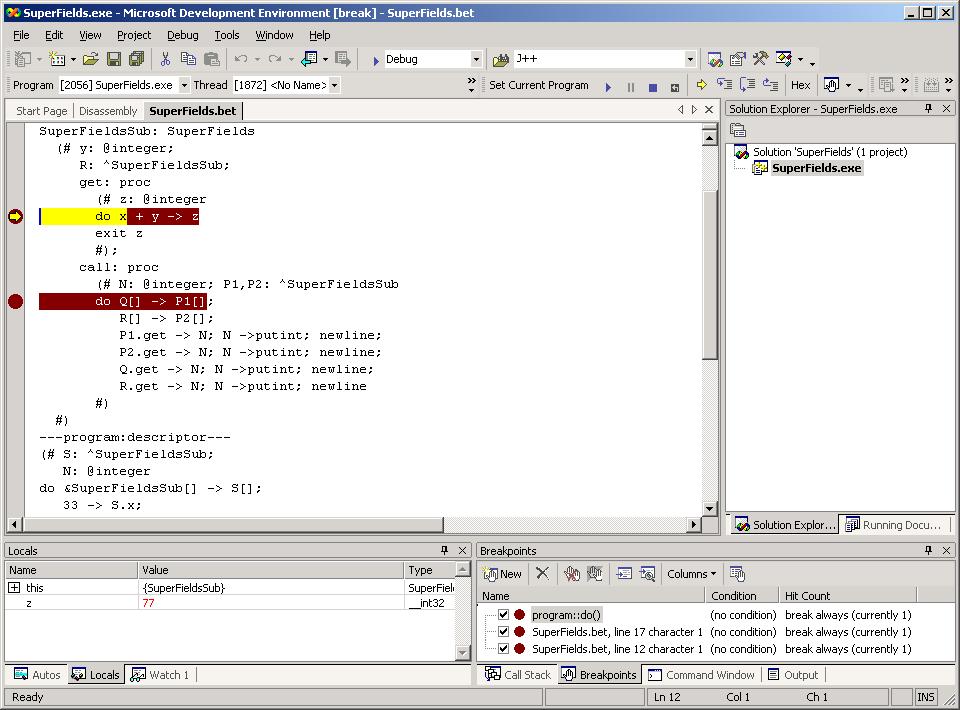
The program will now stop at the do-part of the PROGRAM fragment.
You can now single step, inspect variables etc. at BETA source
level.
As can be seen, a breakpoint has been set in
program.Do
(as described above) as well as in line 12 and 17. The latter two were
set using the contextual right button menu in the SuperFields.bet
source window.get method has been
hit, and a single Step-into command has been issued, thus executing
the statement x + y -> z (the maroon indication of the
statement seems to be off by one - we'll check this later (:-)).
By default Visual Studio will only be able to find source files in the
current directory. This means that when you, e.g., "step into (F11)" a
method residing in a source file outside the current directory, this
will behave as a "step over (F10)"!. To avoid this, you can specify
the Debug Source Files property:
To access the Debug Source Files property page,
right-click on your Solution in Solution
Explorer and choose Properties from the shortcut
menu. Expand the Common Properties folder and click the
Debug Source Files page.
Additional information can be found on, e.g., Visual Studio: Debugging an Executable That Is Not Part of a Visual Studio Solution
DbgCLR.exe. It typically resides in
C:\Program Files\Microsoft.Net\FrameworkSDK\GuiDebug\DbgCLR.exe
.
If you installed .NET Framework as part of Visual Studio .NET 2003 it may
reside in
C:\Program Files\Microsoft Visual Studio .NET 2003\SDK\v1.1\GuiDebug\DbgCLR.exe
DbgCLR.exe by double clicking its icon in the Windows Explorer.
foo.bet has been compiled to foo.exe, you may now
specify foo.exe in menu item [Debug->Program to debug].
[Debug->New Breakpoint (Ctrl-B)] specify
breakpoint in Function program.Do.
[Debug->Start (F5)].
The program will now stop at the do-part of the PROGRAM fragment.
You can now single step, inspect variables etc. at BETA source
level.
Notice that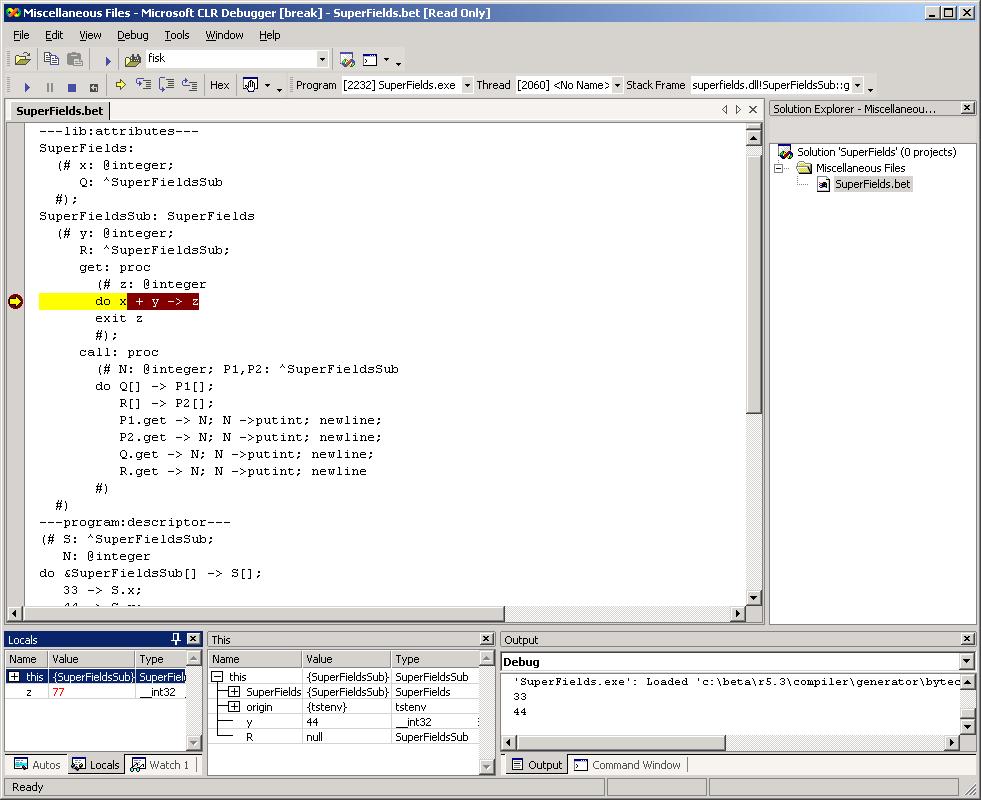
DbgCLR will only be able to automatically
open source files in the current directory.
Thus when you "step into (F11)" a file, that does not reside in the
current directory, this will behave as a step over!
This can be avoided by making the other source file "known" by
preopening it. If you accept saving the solution file, when the
current debug session is ended, the next time you debug the same
program, the previously opened source files will be known.
Addition information: CLR Debugger Solution Model.
cordbg.exe and is normally automatically accessible
from your shell (as the .NET Framework Installer will have included
the path to it in your search path).
If you compiled with nbeta -d, cordbg is very useful for debugging
IL code. It automatically breaks a the main entry point when run as
> cordbg foo.exeThe syntax for breaking in the
Do method of class program is
(cordbg) b program::DoYou may also use cordbg for source level debug, and specify, e.g.,
(cordbg) b foo.bet:16to make it break in line 16 of
foo.bet. In this case foo should be
compiled without the -d option. To get more help on using cordbg
type this:
(cordbg) help
If you want to debug at IL level instead of BETA source level, you can compile with:
> nbeta -d fooor (forcing total recompile):
> nbeta -s 12 -d foo
jdb.
In order to use jdb, a few observations must be made:
<program name>.jar
in a sub directory named jvm.-classpath jvm/<program name>.jar
beta.jdb session must be
prefixed with beta.
main function resides in class beta.program).jdb must be instructed to execute
beta.program.
jdb will normally expect the source files to reside
in the same directory as the class files. The class files used when
executing the program all reside in the above mentioned jar file.jdb to find the source files relative to the
jvm directory, the jar/class files are placed in, the
-sourcepath option is used, as shown in the example below.
jdb supports
reading initial commands from a .jdbrc file (or
jdb.ini file on windows). This file can be placed in the
current directory or in your HOME directory.
A good command to put into that file is
stop in beta.program.Dowhich will cause the debugging session to stop at program start up.
Since the invocation of jdb is a little cumbersom
(especially the setup of the sourcepath), the BETA
compiler will generate a shell script named <program
name>-jdb (with .bat extension on windows),
which invokes jdb on the program.
Below is a session showing BETA source level debugging using this
script.
tcsh> jbeta SuperFields.bet
tcsh> ./SuperFields-jdb
Running jdb on SuperFields:
To stop at program start issue this command: stop in beta.program.Do
Initializing jdb ...
> stop in beta.program.Do
Deferring breakpoint beta.program.Do.
It will be set after the class is loaded.
> run
run beta.program
Set uncaught java.lang.Throwable
Set deferred uncaught java.lang.Throwable
>
VM Started: Set deferred breakpoint beta.program.Do

Breakpoint hit: "thread=Thread-1", beta.program.Do(), line=29 bci=0
29    do &SuperFieldsSub[] -> S[];

Thread-1[1] list
25      #)
26    ---program:descriptor---
27    (# S: ^SuperFieldsSub;
28       N: @integer
29 => do &SuperFieldsSub[] -> S[];
30       33 -> S.x;
31       44 -> S.y;
32       S.x -> putint;
33       newline;
34       S.y -> putint;
Thread-1[1] stop in beta.SuperFieldsSub.get
Deferring breakpoint beta.SuperFieldsSub.get.
It will be set after the class is loaded.
main[1] cont
> Set deferred breakpoint beta.SuperFieldsSub.get
33
44

Breakpoint hit: "thread=Thread-1", beta.SuperFieldsSub.get(), line=12 bci=0
12           do x -> z;

Thread-1[1] list
8      (# y: @integer;
9         R: ^SuperFieldsSub;
10         get: proc
11           (# z: @integer
12 =>        do x -> z;
13              z + y -> z;
14           exit z
15           #);
16         call: proc
17           (# N: @integer; P1,P2: ^SuperFieldsSub

Thread-1[1] next
>
Step completed: "thread=main", beta.SuperFieldsSub.get(), line=13 bci=5
13              z + y -> z;

Thread-1[1] locals
Method arguments:
Local variables:
z = 33
Thread-1[1] dump this
 this = {
    origin: instance of beta.betaenv(id=334)
    y: 44
    R: null
    beta.SuperFields.origin: instance of beta.betaenv(id=334)
    beta.SuperFields.x: 33
    beta.SuperFields.Q: null
    beta.BetaObject.comp$: null
}

Thread-1[1] where
  [1] beta.SuperFieldsSub.get (SuperFields.bet:13)
  [2] beta.program.Do (SuperFields.bet:36)
  [3] beta.Component.run (null)
Thread-1[1] clear beta.SuperFieldsSub.get
Removed: breakpoint beta.SuperFieldsSub.get
Thread-1[1] cont
> 77
77
77
77
77


The application exited
tcsh>